Prioritize...
From this page, you should become familiar with the standard instruments for measuring temperature, wind speed, and precipitation. You should also be able to identify the standard height at which "surface" wind observations are taken and discern the difference between "sustained" wind speed and wind gusts as measured at ASOS sites.
Read...
Since good forecasters start their forecasting process with observations, we need to look more closely at how weather observations are taken--especially observations of temperature, wind speed and precipitation. While measuring these weather variables might seem straightforward, as you're about to see, measurements aren't taken in the same way at all stations. Furthermore, for decades, weather observations were taken solely by humans, but the number of completely automated observations taken with no human intervention continues to increase. Even today, however, students at Penn State still take daily observations for the campus weather station at University Park. Check out the observation card (below) from January 25, 1985. For the record, the icon under the heading of general observations is the universal symbol for blowing snow.

Why do I show this antique observation card? I want you to note the variety of different observations it includes. It's not just high and low temperature, wind speed, and total precipitation! Even something as seemingly simple as "temperature" has observations for maximum, minimum, and set. What's the "set" temperature? Let's find out, and explore some other nuances of measuring temperature.
The Highs and Lows of Temperature
Students at Penn State aren't alone in taking these "old fashioned" observations. Many cooperative observers and some smaller airports rely on the same type of liquid-in-glass max / min thermometers that have been used for decades (see image on the right). While modern digital and electronic equipment has largely replaced less-sophisticated tools and methods, these "low-tech" thermometers are critical for recording daily high and low temperatures at locations where observations are not electronically monitored throughout the day.

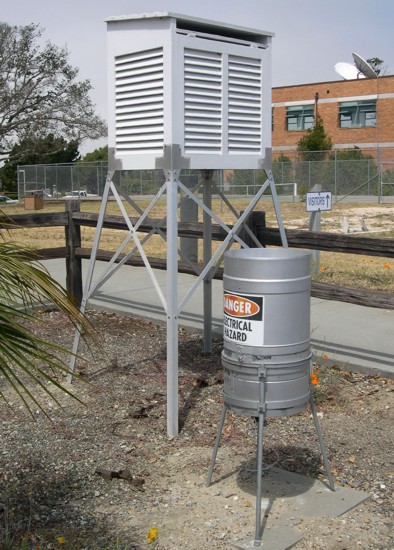
In locations where observations aren't constantly monitored electronically, maximum and minimum thermometers (yes, there are two!) are typically housed in Cotton Region Shelters (credit: NOAA), or "CRS." Cotton Region Shelters are typically painted white to reflect sunlight because too much absorption of direct sunlight could dramatically raise the temperature of the thermometer above the true air temperature. CRS are also mounted about five feet above the surface, away from the drastic temperature changes that occur very near the ground. Their louvers allow ventilation so that the air in contact with the thermometer has essentially the same temperature as the outside air (check out the interior of the CRS, credit: NOAA).
But, the two thermometers in the CRS are not ordinary thermometers. The most important part of the maximum thermometer is the constriction in the bore (credit: NOAA). Think of the constriction as a trap door. As the air temperature increases, the mercury expands and forges through the constriction. But, as the air temperature eventually starts to decrease, the mercury remains trapped beyond the constriction so that the weather observer can determine the high temperature later on. Like a clinical thermometer used to measure a patient's temperature, the observer resets the maximum thermometer to the current temperature (called the "set temperature") by shaking or spinning (centrifuging) the mercury back through the constriction.
The minimum thermometer typically contains alcohol (which has a lower freezing point than mercury). Within the bore of this thermometer, there is a barbell-shaped marker (credit: NOAA) called an index. The barbell on the right of the index registers the minimum temperature. How? As air temperature decreases, the alcohol contracts, and when its retreating meniscus encounters the right side of the barbell, it drags the index along with it. When temperatures increase, however, the expanding alcohol draws the meniscus away from the index and alcohol flows up the bore around the index (the index doesn't move; it stays in a position that corresponds to the minimum temperature). The weather observer can simply read-off the 24-hour minimum temperature (the right barbell) at the observation time and reset the minimum thermometer to the current temperature by tilting the thermometer downward.
Instead of using max / min thermometers inside a CRS, increasing numbers of cooperative observers are using the Maximum Minimum Temperature System (credit: NOAA), or MMTS. Essentially, an MMTS is an electrical thermometer quartered in what I can only describe as a beehive (a circular, louvered shelter). More specifically, the MMTS is a special type of sensor called a thermistor which electronically measures temperature based on the electrical resistivity of a circuit. The MMTS transmits the information from the temperature sensor to a digital display, which can be easily read by the observer.
Meanwhile, at most primary airports, the temperature sensor is an integral component of an Automated Surface Observing System (ASOS). Smaller airports may instead have an Automated Weather Observing System (AWOS), which is basically a less sophisticated version of an ASOS. ASOS and AWOS sites commonly measure temperature with a type of thermistor called a platinum-wire resistance sensor (PRT). A hygrothermometer (credit: NOAA) houses the PRT sensor and also a chilled mirror that measures dew-point temperature.

Getting a Handle on the Wind
Of course, ASOS stations measure more than temperature. The ASOS sensor that measures wind speed is an ultrasonic anemometer (credit: NOAA), which is mounted atop a tower that is typically 10 meters high (some are a bit lower, depending on local restrictions). How can ultrasonic sound waves measure the wind? Well, the transmission of sound waves through the air varies with wind speed. If the wind speed is blowing in the same direction as the sound waves are traveling, the sound waves travel faster (or slower, if the wind is blowing in the opposite direction). With three equally spaced ultrasonic transducers (a transducer is a device that can convert energy from one form to another), the sensor measures how long it takes for ultrasonic waves to travel between transducers. A total of six measurements are taken (one in each direction along each path between transducers) and from those measurements, a computer calculates wind speed and direction.
The two common wind speeds that get reported are sustained wind speeds and gusts. What does "sustained" really mean? At ASOS stations, It's a two-minute average speed, but the two-minute averages are computed from three-second averages of one-second wind speeds, so measuring a sustained wind speed is not straightforward. The smoothing of data through averaging provides a fairly reliable measurement, though. Gusts, on the other hand, are quick "bursts" of faster winds, technically defined as three-second averages that are faster than those immediately before or after.
The ASOS standards for wind measurement, however, are not universal. Reported sustained winds in tropical cyclones over the ocean, for example, are often measured or estimated one-minute averages. But, some agencies, like the Japan Meteorological Agency, use 10-minute averages as a standard for sustained wind speeds in tropical cyclones. In addition to using different averaging periods than ASOS sites, other observing networks don't always take observations at a standard height of around 10 meters. Wind observations from home weather stations, for example, are often measured much lower to the ground and therefore suffer from increased friction and various sheltering issues because of surrounding trees and buildings inherent in many neighborhood settings. The height of a wind observation really matters (in terms of frictional effects and surrounding obstructions), so beware of observation height when interpreting or comparing wind observations. Wind observations that aren't taken near a standard height of 10 meters can be notably different!
Reining in Precipitation
Several types of rain gauges are commonly used to measure precipitation. At the Penn State Weather Station, we use a standard rain gauge to measure precipitation (see image below). For starters, the circle of triangular metal slats helps to buffer the gauge from the wind, lessening its effect on the amount of precipitation falling into the gauge (allowing precipitation, particularly snow, to fall more vertically into the gauge). The outer shell of a standard rain gauge is a metallic cylinder eight inches in diameter. Inside the outer shell, there is a clear, plastic inner cylinder (credit: Penn State University) just over 2.5 inches in diameter into which rain funnels. Given that the inner cylinder's cross-sectional area is one-tenth of the outer cylinder's area, rain funneling into the inner cylinder will rise to a height ten times the actual rainfall - horizontal "squeezing" yields vertical "stretching." Thus, a meager 0.01 inches of rain balloons to a depth of 0.10 inches on a measuring stick, making the otherwise unwieldy task of obtaining 0.01" accuracy much easier.

When the forecast calls for snow, weather observers remove the inner cylinder and the snow accumulates in the hollow outer cylinder. They then determine the liquid equivalent by taking the gauge indoors, melting the snow, and then pouring the liquid into the small beaker to accurately measure its depth. Observers similarly obtain the liquid equivalent of unmelted hail and ice pellets (sleet).
The weighing gauge (credit: NOAA) is another instrument that measures precipitation. Rain collected by the gauge funnels into a hole, below which is a catch bucket. As water accumulates in the bucket, its weight gets converted to a liquid-equivalent depth. Routinely, a mechanically driven pen scrolls across a chart attached to a rotating drum and traces out a record of this depth as a function of time (the drum rotates once every 24 hours). Yet another instrument for measuring rainfall is the tipping-bucket rain gauge (credit: NOAA). For this gauge, collected rainwater gets funneled into a two-compartment bucket; 0.01 inches of rain will fill one compartment and overbalance the bucket so that it tips, emptying the water into a reservoir and moving the second compartment into place beneath the funnel (see a close-up view of the top of a tipping-bucket rain gauge, credit: NOAA). As the bucket tips, it actuates an electric circuit that records rainfall.
Observing stations that report hourly precipitation are likely equipped with a Fischer Porter automatic rain gauge (credit: NOAA). The gauge is approximately five feet tall and has a diameter of two feet. Much like a weighing gauge, precipitation collecting in a catch bucket presses down on a scale. Every 15 minutes, holes are punched on a "ticker tape" (as a function of the weight of the bucket). In this way, the punched tape keeps a running tally of precipitation since the catch bucket was last emptied. Check out the "guts" of a Fisher Porter and a close-up of the punched ticker tape (credit: NOAA).
Naturally, different instruments and standards for taking weather observations can lead to some issues with consistency and quality. If you're interested in reading about a few of these issues, along with a more technical description of ASOS instruments, check out the Explore Further section below. In the meantime, now that we've examined the ways that temperature, precipitation, and wind are measured, we need to familiarize ourselves with the published format of all of these observations. Put on your decoder rings: It's time to learn about decoding METAR observations!
Explore Further...
If you're interested in reading up on some issues arising from the use of different instruments, and / or more technical information about some instruments presented on this page, you may want to check out the following links:
- MMTS versus liquid-in-glass thermometers: A short paper summarizing some key issues that arose when many cooperative observing stations made the switch from old-fashioned liquid-in-glass thermometers to the MMTS.
- Federal ASOS Manual: A complete technical description of ASOS instruments.
- "How Well are We Measuring Snow?": All rain gauges are not created equal, and this paper from the Bulletin of the American Meteorological Society details the various problems that common rain gauges have with measuring snow fall (such as "under catch" because of wind).