 Prioritize...
In this section you get some more practice with how contours are drawn -- this time with isobars (contours of constant pressure). Again, it's important to understand what a contour line means and how it's drawn. You will use this understanding to ultimately extract specific values from a contour map. Read...
In a similar way that analyses of surface isotherms allowed you to easily spot pockets of warm and cold air, analyses of mean sea-level (MSL) isobars will help you to pinpoint areas of high and low pressure. For the record, an isobar is a contour of constant pressure. Note: Do not confuse isobars and isotherms. It is incorrect to call lines of constant pressure "isotherms" and vice versa.
As an apprentice forecaster, you should note that clouds and precipitation typically mark areas of low pressure, while placid, dry weather coincides with centers of high pressure (there are exceptions to every rule, of course). Turn your attention to the analysis of MSL isobars and fronts (the the red/blue lines with circles/triangles... just ignore them for now) at 06Z on August 28, 2011 (below).
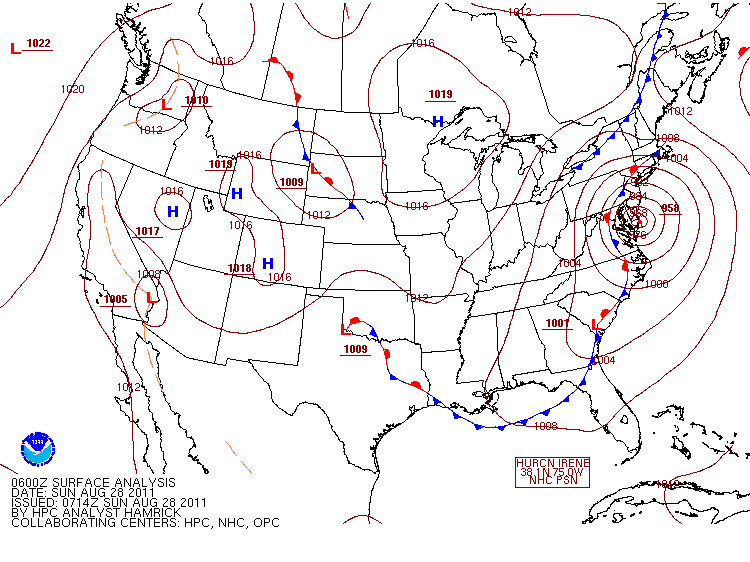
The H's mark centers of high pressure and the L's designate centers of low pressure. To hammer home my point about the close connection between local weather and centers of high and low pressure, I superimposed the analysis of MSL isobars on the corresponding 06Z cloud and radar image (the green, yellow and red blobs represent precipitation). I realize that we haven't yet formally cover the topics of satellite and radar imagery, but I'm sure most of you are somewhat familiar with them.
The obvious question to ask right now is: How do we isopleth mean sea-level isobars? Remember that, in order to decode the mean sea-level pressure on a given station model, you'll need to add a "9" or a "10" in front of the three-digit entry. This does not mean that you must manually decode every station model on the map before you begin. Rather, you will discover that once you decode a few station models, you will develop a "feel" for the pressure pattern, and will thus be able to decode the pressures in your head as you draw the contours.
By convention, all analyses of mean sea-level pressure contain the 1000-mb contour (unless, of course, you're dealing with a map covering a relatively small region that's under the auspice of high pressure). The 1000-mb contour is called the standard contour for a surface pressure map. The standard contour interval for mean sea-level isobars is 4 mb. Thus, after drawing the 1000-mb contour (if applicable) you'll need to draw contours for 1004 mb, 1008 mb, 1012 mb, etc., as well as 996 mb, 992 mb, etc. (assuming you need to go this low).
After all of the appropriate contours are drawn, the centers of low and high pressure are marked with an "L" and an "H", respectively. The conventional color for surface lows is red and the standard color for surface highs is blue. This isn't always the case, however. Many contour plots that you might see on the Internet use color schemes that adhere more to a particular style than strict convention. This is especially true when looking at color-contour maps.
 Key Skill...
Just as you practiced drawing isotherms, here's an opportunity to draw some isobars. On this interactive pressure map, only coded mean sea-level pressures appear on the station models for the eastern half of the United States. Just like the interactive temperature contouring tool, you may draw isobars directly on the map. If you prefer an "old-school" approach, you may print out a hard copy and sharpen your trusty pencil (here's a printable version of the map).When attacking this map, I suggest that you start with the 1016 mb isobar (it's one of the easier lines). Remember that you will be looking for gates coded between "121" and "161" because you are looking for pressures between 1012.1 mb and 1016.1 mb. Note that there is a "Decode Pressures" check box if you are having trouble decoding the pressure field in your head.
After you're done drawing the 1016-mb contour, check your work by selecting "1016 mb" from the pull-down menu and clicking on "Draw Line". The correct isobar will be drawn for you. Just like the interactive temperature contouring tool you may wish to take advantage of the "Show Hints" check-box if you happen to get stuck. Finally, you will want to click on the "Show All" button when you are finished to see the final pressure map.
 Explore Further...
I'll elaborate on the connections between pressure and weather later in the course, but just to pique your interest, I point out that "deep" (intense) low-pressure systems are big wind makers. For example, the 21Z analysis of sea-level isobars over the contiguous states on October 26, 2010, showed a record-setting low-pressure system centered over Minnesota. Indeed, the pressure at the low's center fell below 956 mb on this day, the lowest barometric reading ever measured in Minnesota. The winds associated with this low were fierce, as this detailed 21Z analysis of wind speed (in knots) over the Upper Middle West dramatically shows. The thin, white contours that have "arrowheads" are streamlines. Streamlines are drawn parallel to the wind, with arrowheads pointing in the direction that surface air is moving. Note that there were sustained winds as high as 45 knots (convert to m.p.h.) over South Dakota at this time. Yes, deep lows are big wind makers. Stay tuned for more details.
You can access the most recent analysis of station models, mean sea-level isobars, and radar on the Penn State electronic "map wall" (we call it the "e-wall"). If you're interested in the detailed analyses of pressure, check out the website, coolwx.com (you can select sea-level pressure in the menu on the left).