 Prioritize...
The process of contouring a weather map by hand is quickly becoming a lost art. However, understanding how to read a specific value or range of values from a contour map requires that you know the "rules" by which each contour is drawn. Pay particular attention to the idea that values are always greater on one side of the contour line and less on the other side of the line. Read...
Let's focus our attention on a large region like the Middle West and distill the set of weather observations on each station model down to a single number which, for sake of argument, is the air temperature at each airport. However, such a distilling of data doesn't help you observe any discernible pattern in the data, does it?
But don't give up hope! Just like the contours of constant elevation on the map of Hawaii gave us a sense of organization regarding the dramatically changing topography on the island, drawing isotherms, which are contours of constant temperature, will help us to identify organized patterns of warmth and chill over the Middle West.
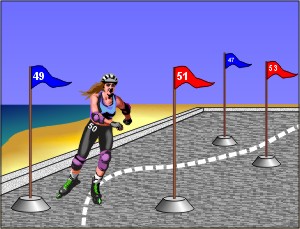
To begin the process of drawing isotherms, we first hit the virtual roller-blading paths along the beach, where a special contest is underway. In order to successfully negotiate the course, roller-bladers can only skate through special pairs of "temperature gates". For each competitor, "legal" gates are relatively easy to spot; a blue marker carries a temperature that's slightly less than than the contestant's number and its twin red marker shows a temperature that is slightly greater than the contestant's number. Failure to roller-blade through a legal pair of temperature gates during the race will result in immediate disqualification! Understanding this simple rule for this contest will help you to draw isotherms on your map.
On most maps of temperature, isotherms are drawn for every multiple of ten degrees Fahrenheit. Sometimes, isotherms that are multiples of five degrees Fahrenheit are included for greater detail (just like if we had drawn elevation contours every 250 feet on the topographical map of Hawaii, it would have greatly enhanced the detail). Remember: An isotherm a line that connects points of equal temperature. So, if you are drawing a 50 degree F isotherm, stations which have a temperature of exactly 50 F will lie directly on the line. Stations with values greater than 50 F will always be on one side of the line, and values less than 50 F will be on the other.
Got the hang of it? Great! Now I'll offer the following protocol for isoplething just so you can earn "style points":
- Like an expert roller-blader negotiating the course of gates, you should trace your isotherm in a neat and smooth course instead of instead of a jagged, jerky path (it's a good idea to initially trace your contours lightly in pencil just in case you accidentally get off course).
- An isotherm should begin and end at an edge of the map, or, alternatively, loop around and close on itself (like the circular contours of constant elevation around Mauna Loa and Mauna Kea).
- An isotherm should never branch or fork and "skate" two different courses at once. Such a branching results in immediate disqualification.
- Typically, you must draw isotherms on weather maps where there are "gaps" in the data (it's an undeniable fact of life that there are a limited number of observation sites). To draw isotherms through a "gap" in the data, you must interpolate (estimate the value of) the temperature between two given data points. For example, if you're drawing a 45-degree isotherm and you come upon two data points marked 49 degrees and 44 degrees, you'll want your isotherm to pass closer to the point marked 44 degrees. In other words, use a little common sense.
- Isopleths should be drawn at equal intervals. There are exceptions, of course. During the cold season, for example, it is sometimes prudent to draw the 32-degree isotherm on a surface temperature analysis. As you know, a reading of 32 degrees marks the melting point of ice (not the "freezing point" as Hale Stone often calls it ... most water contains impurities and freezes at temperature below 32 degrees).
 Key Skill...
Although you may never find yourself drawing contour maps, you should be familiar with the process. In this interactive tool, you can experiment with drawing your own contours (getting hints when you need them) as well as see them being drawn. I urge you to play with this tool a while to gain a better understanding of contours.
Begin by drawing the 50-degree isotherm, applying the spirit of the rules governing the quirky roller-blading race mentioned above. If you would like to work with pencil and paper, feel free to print off the map image and isopleth on your hard copy. If working digitally, you can draw directly on the contouring tool with the handy-dandy digital pencil (move your mouse over the image). Try to "skate" your pencil through two neighboring "gates" marked by temperatures in the upper 40's and the lower 50's. Would you like to see a few of the gates just to get you started? Go to the pull-down menu and select the 50-degree isotherm. Now click the "Show Hints" check-box. A few "gates" will then appear to help you chart your course. If you make a mistake, don't get nervous. Simply select "Erasing" to make your mistake go away.
When you're done, make sure you select the 50-degree isotherm in the pull-down menu below the map. Then click "Draw Line" to watch the virtual pencil "skate" through the proper gates and correctly draw the 50-degree isotherm.
Now compare your isotherm to this solution. Need more practice? Try drawing the 80-degree isotherm. When you're done, select the 80-degree isotherm in the pull-down menu below the map and click "Draw Line". Please note that the isotherm the virtual pencil traces is a closed contour. For the record, it encloses a pocket of hot air over the Ohio River Valley. How did you do? If you feel a little shaky about isoplething, don't worry ... all you need is a little more practice. So "jump back on the horse" and choose another isotherm to draw. Then check your work to make sure you're on target. Repeat until you feel confident that you're up to speed on isoplething.