 Prioritize...
One of the most important concepts in this lesson that students have trouble with is figuring out the wind direction from a station model. Make sure that you do not leave this section without mastering this skill. Also, make sure that you can express the wind speed (including the units) for given a station model "flag". Read...
One of the most fundamental rules that you will learn as an apprentice weather forecaster is that the direction of the wind is always the direction FROM which the wind blows and NOT the direction toward which the wind blows. So, if the wind blows from the north, for example, it is a "northerly" (or "north") wind, NOT a "southerly" or "south" wind. If you own a weather vane, remembering this rule should be rather easy because a wind vane points into the wind and thus toward the direction FROM which the wind blows.
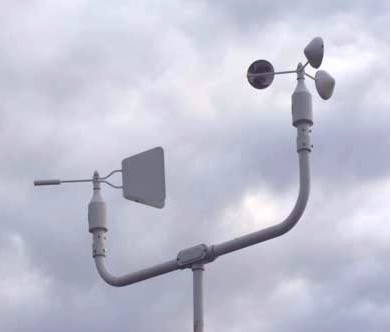
The rotating cup anemometer shown on the right is a popular instrument for measuring sustained wind speed at airports and weather stations. It is the sustained wind speed that routinely appears on station models. To determine the sustained wind speed, the revolution rate of a rotating cup anemometer is typically averaged over a one-minute period and then mathematically converted to knots.
The wind is sometimes unsteady, with brief, sudden increases in wind speed called gusts. As a general rule, gusts last less than 20 seconds. Weather observers typically only report gusts when the wind varies by greater than 10 knots (between the peaks and lulls). However, reported wind gusts do not appear on station models.
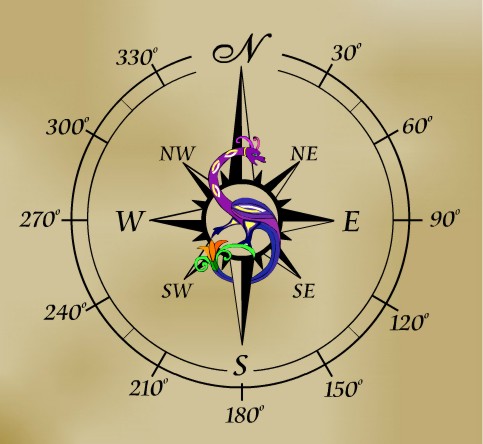
On a station model, the thin-solid line (often referred to as the "flag") extending outward from the sky coverage symbol denotes the wind direction. Remember, wind direction is always the direction from which the wind is blowing. Rather than brand the wind with a general direction such as "north" or "southeast", weather forecasters routinely use standard compass angles to fine-tune the wind direction. For sake of illustration, the wind direction from the north is said to blow from a direction of 0 degrees. A wind that blows from the east is a 90-degree wind, while a wind direction of 70 degrees (as in the example on the right) corresponds to a wind that blows from the east-northeast.
Now we turn to the decoding of sustained wind speed, which, on station models, is always expressed in units of knots (1 knot = 1.15 mph). To quantify the speed of the wind, again examine the example on the right. On the clockwise side of the line representing wind direction at the station, note the two relatively long counting notches and one shorter notch (often called "wind barbs"). Each longer notch counts as a tally of 10 knots (actually, each longer notch represents a speed of 8 to 12 knots, but weather forecasters operationally choose the middle value of 10 knots as a representative value and, of course, for simplicity). The shorter notch counts as a tally of five knots. Thus, the representative speed of the wind at the station at the time of observation is 25 knots.
To convert between knots and the more familiar "miles an hour", multiply knots by a factor of 1.15. For a quick and easy way to perform this conversion, imagine you're at a restaurant and the bill is $25. You want to leave a 15% tip. To compute a 15% tip, first multiply by 10%. You get $2.50. Then take half of $2.50. You get $1.25. Now add the two to get $3.75. That's your tip. Your total bill is $28.75. Converting knots to miles an hour is the same as computing your tip and total bill at a restaurant. So, 25 knots equals 28.75 miles an hour. That's the same result you would get if you multiplied 25 by the 1.15 factor in the conversion formula!
If the surface wind is "calm", then it has neither direction nor speed. In this case, a larger circle is drawn around the circle that represents the weather station. As an example, check out (below) the 1543Z map of station models over a portion of the western United States on January 13, 2012. Note the number of station models in northern California and Nevada with circles drawn around them, indicating relatively calm winds. For the most part, the skies were clear where winds were relatively calm, but there were a few stations reporting light fog and haze in central California.
For very strong winds, a "triangular" barb counts as a tally of 50 knots. The use of the 50 knot symbol is a bit unrealistic at the surface in most locations, however, because sustained winds rarely reach such speeds. Of course, wind gusts of 55 knots are always possible (severe thunderstorms, strong cold fronts, etc.). You're more likely to observe a sustained 55-knot wind near the Atlantic and Gulf Coasts with a hurricane nearby. For example, check out the sustained 50-knot wind at Cape Hatteras, North Carolina, early on August 27, 2011 (12Z station models and isobars), as Hurricane Irene approached from the south (Irene's track; satellite image of Irene at 1245Z on the 27th).
 Key Skill...
Looking at the animated station model tool, remember that the direction the wind is blowing from is denoted by the position of the flag stick. Experiment with different wind directions to see how they would be represented on the station model. Moving on to wind speed, try out different wind speeds and examine the resulting group of wind barbs. Remember that a long barb counts for 10 knots, a small barb for 5 knots, and a black triangle for 50 knots. Don't forget to also try an observation with calm winds.
 Quiz Yourself...
Think you have a good handle on wind speed and direction on a station model? Take this self-quiz below to see how you do. Begin by hitting the "Quiz me" button. Fill in the missing wind direction and speed, then hit "Submit" to check your answer. Wind direction can be rounded to the nearest 10 degrees and wind speed is to the nearest 5 knots. You may also turn on some directional hint lines if you have trouble estimating angles. Explore Further...
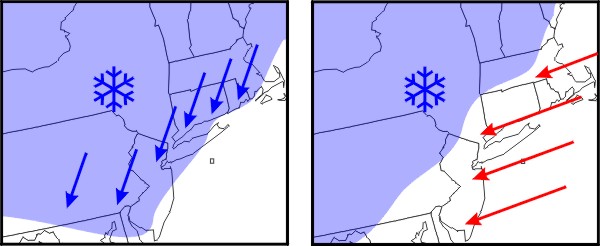
Lest you think I'm splitting hairs by resorting to specific compass angles to designate wind direction, I stress that slight changes in the wind direction can translate into large changes in the weather forecast. For example, suppose it's December along the Northeast Seaboard. At this time of year, sea-surface temperatures over the offshore waters of the Atlantic are typically in the 40's (Fahrenheit). Thus, the temperatures of the air overlying Atlantic waters are often higher than air temperatures over the colder land. Now suppose a storm system approaches New York City from the south and the wind direction at Central Park is 20 degrees. Such a north-northeast wind would bring cold air into the Big Apple strictly via a land route, which, as you might guess, increases the chances of snow. If the wind direction were 70 degrees, however (meaning that the trajectory of the air comes into New York City from the Atlantic), then a changeover from snow to rain is more likely. We'll learn more about similar kinds of weather situations later in the course. I raised the point because I wanted you to know that I'm not just splitting hairs and asking you to learn something that has little meteorological meaning.