 Prioritize...
Dew points are one of the more problematic weather variables. Here's the thing to remember... Dew points always tell you about the water vapor content of the atmosphere. Whenever you are faced with a question involving water processes: evaporation, condensation, clouds, etc., dew points should be in your mind. Read...
Everyone will surely recognize that water is an important player in weather. Thus, it’s no surprise that there is a variable relating to water plotted on the station model. This variable is called the dew point temperature. By definition, the dew point is the approximate temperature to which the water vapor in the air must be cooled in order for it to condense into liquid water drops. However, dew point temperature is much more than this seemingly straightforward definition, and to understand the details we have to delve a bit deeper.
As it turns out, the dew point temperature is an absolute measure of the amount of water vapor in the air. This is a very important statement which sets dew point temperature apart from many of the other variables that describe moisture in the atmosphere. It’s not that these variables don’t have their uses (indeed they do); it’s just that they don’t depend solely on the amount of water vapor in the air. In the interest of full disclosure, moisture in the atmosphere is a complicated topic, the understanding of which will require an in-depth discussion that is not appropriate for this introductory lesson. Rest assured, we will have this discussion later in the course. In the meantime, let me begin to paint a picture about the role of water in the atmosphere.
An obvious starting point for this introduction is, “What is water vapor?” Now, I’m sure that everyone has learned at some point that matter exists in three states: solid, liquid, and gas. Water is one of the rare substances that can exist in all three states naturally in our atmosphere. We are well familiar with water’s solid (ice) and liquid forms, but our understanding of its vapor state is a bit more elusive. The first thing that you need to recognize is that water vapor is a gas. Just like any other gas (oxygen, nitrogen, carbon dioxide, etc.) it is invisible. Let me reiterate... Water vapor is an invisible gas.
Often folks confuse what are actually condensed (liquid) water droplets as water vapor. For example, check out this image of a steaming tea kettle. Within the effluent escaping from the spout, where is the water only in vapor form? (Hint: It’s not in the part you can see.) Although there is likely some water molecules remaining in the vapor state in this visible “cloud”, most of the water that you can see is actually in the form of tiny liquid drops. If you look closely, there appears to be a gap between the tea kettle’s spout and the visible cloud (here's an annotated image of the tea kettle). This is where the water exists in a pure vapor state. In fact, this is only portion of the effluent that is “steam”, or super-heated water vapor. The “cloud” you can see isn’t technically steam either.

The next important thing to realize is that water vapor behaves just like any other gas. On a molecular level, water vapor behaves just like oxygen, nitrogen, carbon dioxide, etc. Consider a situation where you had a box of “air” (containing all of the molecules normally found in the atmosphere). This is very much like having a box of various colored marbles. These marbles (because they have a lot of energy) are zooming around, bouncing off the sides of the box and each other. However, each marble is acting independently from each other marble. This means that in our box of air, the oxygen molecules are acting independently of (and oblivious to) other molecules – including water molecules. The implication of all of this is: Air does not “hold” water vapor. We’ll discuss this idea in much more detail later in the course, but I wanted you to start thinking correctly about water vapor from the start.
Now we’ve established the properties of water vapor, we need to discuss the process by which water changes phase (namely to and from water vapor). When transitioning from a gas to a liquid, water undergoes a process called condensation. Likewise, when transitioning from a liquid to a gas, the process is called evaporation. (I should also mention here that solid to vapor and vapor to solid transitions are called sublimation and deposition, respectively.) Later in the course we’ll explore these “phase transitions” in more detail. However, at this point all I want you to understand that evaporation and condensation events are taking place all the time, everywhere around you. Find that hard to believe? Let me try to convince you.
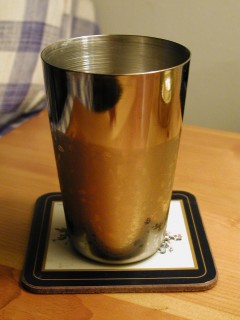
Take a look at the metal glass on the right. The bottom of the glass is obviously coated with a layer of small liquid water drops (often called “dew”), while the top is not. Here’s what’s happening. Molecules of water in the gas phase (water vapor) are zinging around in the air. When a water vapor molecule strikes an object (like the side of the glass), it may “stick” (that is, condense on the surface). I say “may” because there is only some probability that the molecule is captured by the surface. This probability is complicated and depends on many factors, so let’s just say that sometimes the molecule will “stick” (and sometimes it won’t). If it does stick, then there is another probability that within some time frame, the molecule will become “unstuck” (that is, evaporate from the surface) and return to the gas phase. Thus on all surfaces, there is a probability of condensation and a probability of evaporation for each gas molecule that encounters it. These probabilities are always non-zero, and thus we have a rate of condensation and a rate of evaporation for every surface.
So, looking at our glass half-covered in dew, we have said that molecules are impacting (condensing) and leaving (evaporating) on both top and bottom surface of the glass. So why does the bottom half contain a liquid coating while the top remains dry? The answer lies in the fact that the rates of condensation and evaporation are not equal everywhere. On the bottom of the glass, the rate of evaporation is less than the rate of condensation, thus there is a net increase in liquid water (we say “net condensation”). On the top of the glass, the rate of evaporation is greater than the rate of condensation. So, there is a net decrease in liquid water (we say “net evaporation”). As you might have guessed, the net rates of condensation/evaporation depend on temperature – the colder the glass, the greater the net condensation. Note, it also depends greatly on the amount of water vapor in the air – the more water vapor the air, the greater the net condensation.
Finally, let’s revisit our definition of dew point temperature. We said that the dew point is the approximate temperature to which the water vapor in the air must be cooled in order for it to condense into liquid water drops, and that the dew point temperature is an absolute measure of the amount of water vapor in the air—the higher the concentration of water vapor, the higher the dew point. Can you now see how these two ideas connect? If the air contains a high concentration of water vapor, then net condensation will occur at a higher temperature (that is, at a high dew point temperature). If water vapor concentrations are very low, then net condensation will not occur until the air is very cold (that is, at a low dew point temperature). If the dew point temperature is less than 32 degrees, the term frost point is, technically, more appropriate than "dew point" because frost will form (by deposition, not condensation) instead of dew.
One final thought about dew point. Often what is most important to us humans is how we are going to be affected by the weather. So what do we care if the dew point is 40 F versus 60 F? Well it turns out that the dew point affects the way the air “feels” – whether it be dry or muggy. Since our skin temperature is regulated to some degree by evaporation of sweat, it would be logical that we would be affected to some degree by the dew point temperature. Certainly, describing how something “feels” can be a bit dicey in a science course because it’s a somewhat subjective topic, but examine the table below for a rough guide on how the air might “feel” based on dew point temperature.
| Dew Point | General level of comfort |
|---|---|
| 60 degrees | For most people, the air starts to feel a tad "muggy" or "sticky." |
| 65 degrees | The air starts to feel "muggy" or "sticky." |
| 70 degrees | The air is sultry and tropical and generally uncomfortable. |
| 75 degrees or higher | The air is oppressive and stifling. |
This about concludes our introductory look at moisture in the atmosphere. You will discover that throughout the course we will invoke dew point temperature when exploring processes that involve moisture. Whenever you come across dew point just always remind yourself that dew point is a measure of water vapor.
 Key Skill...
Decoding the dew point temperature from a station model is a much easier than understanding the concept of dew point itself (thankfully). Check out the interactive station model tool below. The number located in the lower-left corner of the model is the dew point temperature expressed in degrees Fahrenheit (or Celsius, depending on the country of origin). In this case, the station temperature is 63 degrees F. Feel free to alter the dew point temperature (using the input field on the right) and see how the station model changes.
To see station-model dew point temperature in action, check out the most current surface observations. To get a better picture of the dew point temperatures around the U.S., check out the most recent dew point temperature analysis.
 Explore Further...
A discussion about observing dew point temperature would not be complete without talking about the range of dew point temperatures one might typically observe. As for an example of the upper-limits that dew points can reach, check out (below) the 01Z analysis of surface dew points on July 20, 2011 (the evening of July 19), and note the readings in the low 80's in North Dakota (the small, darker-green pocket). Indeed, the 00Z station model observations on July 20th show numerous dew point readings over 80 degrees throughout North Dakota and western Minnesota (note the "95 over 86" temperature/dew point reading in southeastern N. Dakota... oppressive!). Meanwhile, at a local observing station at Moorhead, Minnesota, the dew point climbed to an incredible 88 degrees Fahrenheit, setting the all-time record for the highest dew point ever recorded in the state! 
So, under what conditions do these high dew points occur? It turns out that you need a combination of factors. In this case, strong winds from the south all throughout the Great Plains brought in moist air northward, all the way from the Gulf of Mexico. This region also experienced strong storms just the night before, leaving the ground saturated with moisture (which was evaporating during the heat of the day, adding water vapor molecules to the air). Finally, this was the height of the growing season so plants were strongly transpiring adding yet more water vapor to the air. I encourage you to read this account from the National Weather Service of the Moorhead, MN observation (it also briefly discusses the world climatology of high dew points... very interesting indeed). If you want to read more, here is another good article on the subject of high dew points.
Turning our attention to the lower end of the observable dew point scale, under what conditions would you envision very low dew points? In a desert like Death Valley in the heat of the summer? Not quite. It turns out that the lowest dew points are most often observed in winter during outbreaks of cold, dry Arctic air. Take a look at the station model observations (below) for 11Z on January 16, 2009. Notice the -47 F and -45 F dew points located over northern Minnesota. This is some really dry air, folks! While such low dew points are rare for the continental United States, it is fairly easy to find similar readings in the source region of these Arctic "chunks" of air. Case in point, check out this station model plot of of Alaska on January 19, 2012. Notice the extremely lo dew point in the interior of Alaska and the Yukon Territories of Canada -- there's even a -50F reading!