 Prioritize...
In order to analyze contour maps effectively, you must first be able to visualize what the contours are representing. Perhaps the easiest way to do this is by first looking at contours of constant elevation. Make sure that you are comfortable with elevation contour maps (called topographical maps) before moving on to something a bit more abstract, like contours of constant temperature for example. Read...
If you are an avid hiker or skier, you've probably consulted a topographical map for insights into elevation and the "grade" (steepness) of slopes and hiking trails. Believe it or not, deciphering topographical maps actually lends itself to the process of interpreting weather maps.
To get you started, let's look at the the Big Island of Hawaii. Just in case you're not familiar with the topography of Hawaii, let's take a virtual fly-by of the Big Island to get a sense of the dramatically changing elevation on the Big Island. As you might have guessed, elevation changes rapidly, varying from sea level to the volcanic summits of Mauna Loa and Mauna Kea at 13,452 feet and 13,796 feet (respectively) in a relatively short distance.
Now that you have a sense for the wildly varying elevations on Hawaii, focus your attention on a topographical map of the Big Island (below). For the record, such a two-dimensional map represents a "plan" or "top-down" view".
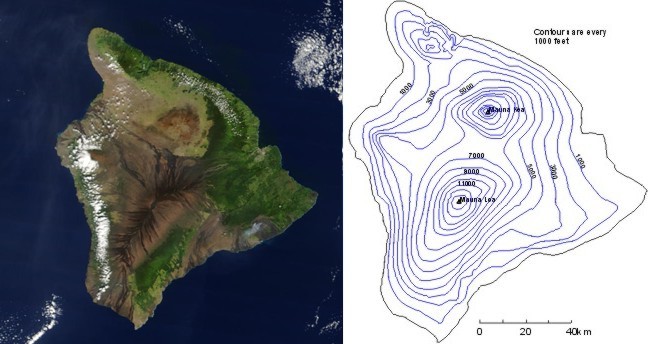
On a topographical map, each contour on the map is an "isopleth", connecting points that lie at the same elevation above sea level ("iso" translates to "equal" and "pleth" means "value"). In this case, isopleths are drawn for every 1,000 feet of elevation above sea level (I point out, however, that such a choice is strictly arbitrary). Isopleths could have been drawn for every 250 feet above sea level, meaning that there would be four times the number of isopleths on the map, probably making it look a little cluttered. The arbitrary choice of 1000 feet for the "contour interval" was a trade-off between the look of the map and its detail.
To explain what I mean by "detail", consider the southernmost tip of the island. Suppose I asked you to locate the point precisely due north of the southernmost tip that has an elevation of 400 feet. With isopleths drawn every 1000 feet, you must visually "interpolate", eyeballing the distance from the southernmost tip to the 1000-foot contour and then estimating a reasonable intermediate spot to place the point. Had contours been drawn every 250 feet instead of every 1,000 feet (the cluttered look), your task would have been a little easier and your answer would likely have been more accurate.
Just in case you're having difficulty making the connection between a three-dimensional mountain and a two-dimensional topographical map, I've created a virtual object of Hawaii and its corresponding contours to help you to better visualize what I'm talking about. What you now see is an electronic representation of the Big Island. To flip back and forth between a head-on view and a plan view of the island, click and drag up or down on a point on the map. Clicking and dragging right or left will rotate the map to further enhance your perspective.
Start with a head-on view of the island that shows the vertical grandeur of the mountains. Pay close attention to the contours of constant elevation, particularly to those leading to the summit of the island's tallest mountain. Now flip back to the plan view and observe how tightly packed contours of constant elevation make a bull's-eye around the summit of the mountain. Such a packing means that elevation changes rapidly over short distances, indicating a steep grade (you would expect the terrain to be steep near the summit of a mountain nearly 14,000 feet high).
Complete your interactive experience by performing similar experiments at other places on the island. Hopefully, this interactive exercise cleared up any remaining confusion you might have regarding the process of mapping three-dimensional topography onto a two-dimensional topographical map.
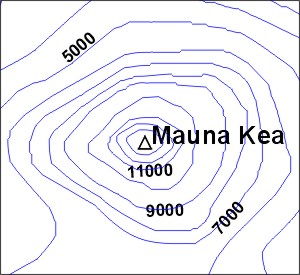
Looking at this map you might get the mistaken notion that all isopleths are closed curves or circles. Depending on the breadth of the map, however, some contours could conceivably extend from one side of the map to another without making a closed loop. Indeed, if I zoom in on the topographical map of the Big Island and restrict my focus just to Mauna Kea (see image to the right), some elevation contours now simply end at a boundary.
Lest you think that I must zoom in on a topographical map in order to create such a "cropped" look, I should point out that contours ending at a map boundary occur routinely. We will address this issue in just a bit. For now, let's delve into the process of contouring a weather map.
Read on.